|
Amna syed
11/14/2015 08:06:39 am
Mine and viola's project u said that we could do two graphs so does that mean we have 2 equations and 2 introplaote and extrapolate
Reply
Mr. Bigsby
11/14/2015 03:40:10 pm
Yes, you will have two regression equations. One for each set of data. However, you only need to interpolate and extrapolate for one of the data sets. You should also make sure to comment on which graph/equation/independent variable had a stronger relationship with your dependent variable. That's why you are doing two, to see which is a better predictor.
Reply
Amna
11/15/2015 06:31:46 am
okay
Reply
Allyson Carter
11/15/2015 06:36:10 am
So are we will be presenting this to the class on the 23?
Reply
Mr. Bigsby
11/15/2015 12:13:57 pm
Yes, your presentations will be on the 23rd.
Reply
Hazel Montgomery-Walsh
11/15/2015 04:40:49 pm
This video made me a lot more excited for the project! Thanks!
Reply
Mr. Bigsby
11/16/2015 04:38:38 pm
You can present any way you like. An iMovie sounds cool, I've never seen that. Is it a Mac file? You might want to test that it can be played on the school computer. Or maybe post it to youtube or similar website that can play it in class.
Reply
Emily Ritzes
11/15/2015 05:11:00 pm
Hey just watched the video I know it's kinda late but I watched it.
Reply
Jaelyn
11/16/2015 12:38:17 pm
For me and Karlis project we were thinking about doing three different graphs a line graph a bar graph and a chart can we do that or does it have to be just one type of graph
Reply
Mr. Bigsby
11/16/2015 04:39:47 pm
A scatter plot should be the best model for this project so just stick with that.
Reply
Erica
11/16/2015 01:13:06 pm
Are we supposed to use a power point? Also, are we working on this in class?
Reply
Viola
11/16/2015 02:52:23 pm
You can do a PowerPoint if you want, but you can also do a poster or something like that. Also, we're not working on the project itself in class anymore.
Reply
Mr. Bigsby
11/16/2015 04:46:02 pm
That's right Viola, it can be presented in any manner you choose.
Megan
11/16/2015 03:59:44 pm
Me and Julianna had to change our project from does the size of the bat effect the distance the ball will travel to does the material of the bat effect the distance the ball will travel
Reply
Mr. Bigsby
11/16/2015 04:49:20 pm
The project should include two QUANTITIES that you suspect to be related. That way you can make a prediction outside your data set. So look for an independent variable that can be counted. Maybe weight?
Reply
Alexis Kahler
11/16/2015 04:10:20 pm
makes me a lot me comfortable about the project.
Reply
Fletcher thomas
11/16/2015 05:00:32 pm
thank you so much this helped me under stand the project alot more><
Reply
Logan Nix
11/16/2015 05:14:36 pm
this makes me even more excited to finish up the project and present it
Reply
Julianna
11/16/2015 06:27:45 pm
Reply
Piper and Kendle W
11/19/2015 10:13:37 am
We understand it alittle more now :)
Reply
Now i understand
11/19/2015 02:57:56 pm
Taylor Hemingway
Reply
Sarina
11/19/2015 05:58:14 pm
This makes the project way easier! Thanks!
Reply
Erica
11/21/2015 08:43:03 am
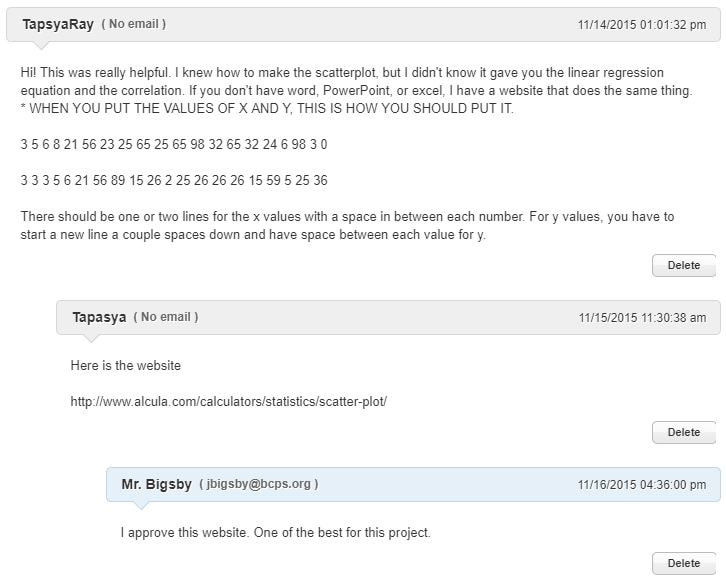
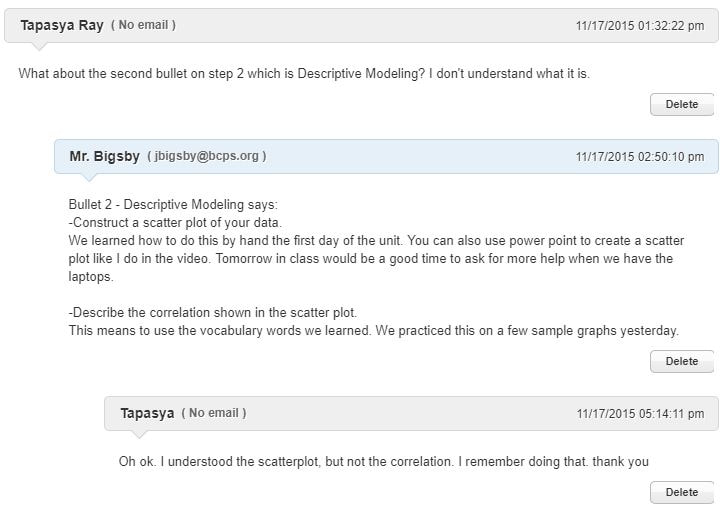
For the project, does the equation have to be y=ax+b? The website Tapasya recommended had y=a+bx. Also, does "describe correlation" mean positive/negative association, etc?
Reply
Mr. Bigsby
11/22/2015 10:50:21 am
It does not matter what order you write the slope and intercept as long as they are the correct numbers. Yes, describe correlation means to use the vocabulary we learned and tell what it means.
Reply
Georgia
11/21/2015 01:26:25 pm
cool
Reply
Ethan Anderson
11/21/2015 05:55:13 pm
Good video!
Reply
Maddox
11/23/2015 02:15:12 pm
Hi.
Reply
rose warner
11/23/2015 05:38:32 pm
forgot to comment but over all it helped me and georgia with our project
Reply
Karli
11/30/2015 05:33:10 pm
Sup
Reply
Krissy
12/1/2015 06:01:36 pm
I didn't have any access to internet for a few days so now I'm commenting on all the videos I missed. I hope this brings my grades uo.
Reply
Your comment will be posted after it is approved.
Leave a Reply. |
Archives
December 2020
Categories |


 RSS Feed
